kaggle房价预测:使用Python综合探索数据 January 23, 2018 > 学习[COMPREHENSIVE DATA EXPLORATION WITH PYTHON](https://www.kaggle.com/pmarcelino/comprehensive-data-exploration-with-python "COMPREHENSIVE DATA EXPLORATION WITH PYTHON")笔记 **'The most difficult thing in life is to know yourself'** <!--more--> 作者按以下章节展开讲解 - 理解问题 - 分析理解每个变量,以及每个变量的意义和对房价预测的重要性 - 单变量学习 - 只关注因变量`SalePrice`并且想办法对它了解更多 - 多变量学习 - 去尝试搞清楚自变量和因变量之间的关系 - 基础数据清理 - 处理缺失的数据,虚假的数据和分类数据数字化 - 测试假设 - 检查数据是否符合大多数多元技术所要求的假设(正态性) 下面首先看一下训练数据都有什么字段吧。 ```python import pandas as pd import matplotlib.pyplot as plt import seaborn as sns import numpy as np from scipy.stats import norm from sklearn.preprocessing import StandardScaler from scipy import stats import warnings warnings.filterwarnings('ignore') %matplotlib inline ``` ```python df_train = pd.read_csv('data/kaggle_house_pred_train.csv') #check the decoration df_train.columns ``` Index(['Id', 'MSSubClass', 'MSZoning', 'LotFrontage', 'LotArea', 'Street', 'Alley', 'LotShape', 'LandContour', 'Utilities', 'LotConfig', 'LandSlope', 'Neighborhood', 'Condition1', 'Condition2', 'BldgType', 'HouseStyle', 'OverallQual', 'OverallCond', 'YearBuilt', 'YearRemodAdd', 'RoofStyle', 'RoofMatl', 'Exterior1st', 'Exterior2nd', 'MasVnrType', 'MasVnrArea', 'ExterQual', 'ExterCond', 'Foundation', 'BsmtQual', 'BsmtCond', 'BsmtExposure', 'BsmtFinType1', 'BsmtFinSF1', 'BsmtFinType2', 'BsmtFinSF2', 'BsmtUnfSF', 'TotalBsmtSF', 'Heating', 'HeatingQC', 'CentralAir', 'Electrical', '1stFlrSF', '2ndFlrSF', 'LowQualFinSF', 'GrLivArea', 'BsmtFullBath', 'BsmtHalfBath', 'FullBath', 'HalfBath', 'BedroomAbvGr', 'KitchenAbvGr', 'KitchenQual', 'TotRmsAbvGrd', 'Functional', 'Fireplaces', 'FireplaceQu', 'GarageType', 'GarageYrBlt', 'GarageFinish', 'GarageCars', 'GarageArea', 'GarageQual', 'GarageCond', 'PavedDrive', 'WoodDeckSF', 'OpenPorchSF', 'EnclosedPorch', '3SsnPorch', 'ScreenPorch', 'PoolArea', 'PoolQC', 'Fence', 'MiscFeature', 'MiscVal', 'MoSold', 'YrSold', 'SaleType', 'SaleCondition', 'SalePrice'], dtype='object') ### 理解问题 **Try to understand each variable and relevance to this house prices problem.** 为了使分析有所规范,所以可以做这样一个表格: > - 变量- 变量名称. - 类型 - 变量类型的标识。这个字段有两个可能的值:'数字'或'分类'。 - 字段 - 变量段的标识。我们可以定义三种选型:建筑,空间和位置。当我们说“建筑”时,我们是指与建筑物的物理特征相关的变量(例如“OverallQual”)。当我们说'空间'时,我们是指一个报告房子空间属性的变量(例如'TotalBsmtSF')。最后,当我们说“地点”的时候,我们是指一个变量,它提供了房子所在地的信息(例如“Neighborhood”)。 - 期望 - 我们对“SalePrice”中的变量影响的期望。我们可以使用“高”,“中”和“低”的分类尺度作为可能的值。 - 结论 - 在我们快速查看数据之后,我们对变量重要性的结论。我们可以保持与“期望”相同的分类尺度。 - 评论 - 你自己的评论 “类型”和“字段”只是可能的特称参考,与这两个字段相比,“期望”一栏显得非常重要,因为他有助于我们提升“第六感”。(老外也有sixth sense啊) 要想做这样一个表格,就必须理解每个变量的含义(kaggle数据页面有介绍每个变量的含义),并且自问: - 当你买房的时候你会考虑哪些变量? - 如果要考虑某个变量,这个变量有多重要?他的重要程度 - 一个变量的信息是否早已经被另一个变量所描述?简而言之,y和x有关,训练的时候是不是只考虑x就可以了? 问完就可以填写“期望”这个字段了。 接下来可以做一些这些变量和售价之间的散点图,观察这些变量是否和我们预期的一样重要,然后填写“结论”。 作者认为下面几个变量很重要: - OverallQua - YearBuilt - TotalBsmtSF - GrLivArea 选择了两个“建筑”变量(“OverallQua”和“YearBuilt”)和两个“空间”变量(“TotalBsmtSF”和“GrLivArea”)。这可能有点意外,因为它违背了房地产的口头禅,所有重要的事情是“位置,位置和位置”。对于分类变量,这种快速数据检查过程可能有些苛刻。 例如,作者预计“Neigborhood”变量会更加相关,但在分析数据之后,作者最终将其排除在外。 也许这与使用 scatter plots 而不是 boxplots 相关, scatter plots 适合分类变量的可视化。数据可视化的方式往往影响我们的结论。 ### 单变量学习 分析“SalePrice” “SalePrice”是我们探索的原因,首先看一下他的大致长相。 ```python df_train['SalePrice'].describe() ``` count 1460.000000 mean 180921.195890 std 79442.502883 min 34900.000000 25% 129975.000000 50% 163000.000000 75% 214000.000000 max 755000.000000 Name: SalePrice, dtype: float64 看起来售价的最小值也大于0,哇偶,上帝,太好了:smile:这样不用担心有人为特性影响到我们的模型了。 ```python # 绘制直方图 sns.distplot(df_train['SalePrice']) ``` <matplotlib.axes._subplots.AxesSubplot at 0x7faa0ba60eb8> 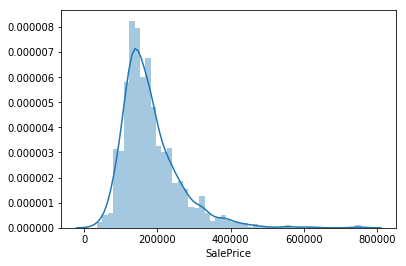 - 可以看出,偏离正态分布 - 可以明显看出偏度为正 - 大致看出峰度 [这里](https://support.minitab.com/zh-cn/minitab/18/help-and-how-to/statistics/basic-statistics/supporting-topics/data-concepts/how-skewness-and-kurtosis-affect-your-distribution/)补充一下偏度和峰度。 ```python # df_train # df_train['SalePrice'] print("Skewness: %f" % df_train['SalePrice'].skew()) print("Kurtosis: %f" % df_train['SalePrice'].kurt()) ``` Skewness: 1.882876 Kurtosis: 6.536282 ### 多变量学习 #### 和数字类型变量之间的关系 ```python # scatter plot grlivarea/saleprice var = 'GrLivArea' data = pd.concat([df_train['SalePrice'], df_train[var]], axis=1) data.plot.scatter(x=var, y='SalePrice', ylim=(0,800000)); ``` 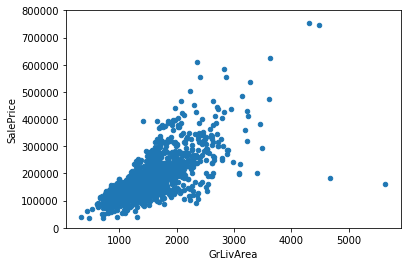 看起来`SalePrice`和`GrLivArea`是线性关系 ```python # scatter plot totalbsmtsf/saleprice var = 'TotalBsmtSF' data = pd.concat([df_train['SalePrice'], df_train[var]], axis=1) data.plot.scatter(x=var, y='SalePrice', ylim=(0,800000)); ``` 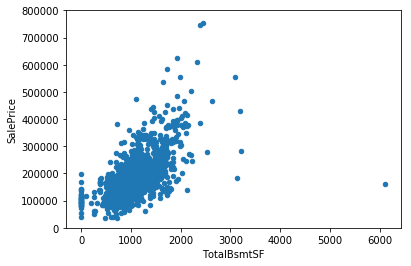 看起来二者像指数关系。 #### 和类别变量之间的关系 ```python #box plot overallqual/saleprice var = 'OverallQual' data = pd.concat([df_train['SalePrice'], df_train[var]], axis=1) plt.subplots(figsize=(8, 6)) fig = sns.boxplot(x=var, y="SalePrice", data=data) fig.axis(ymin=0, ymax=800000); ``` 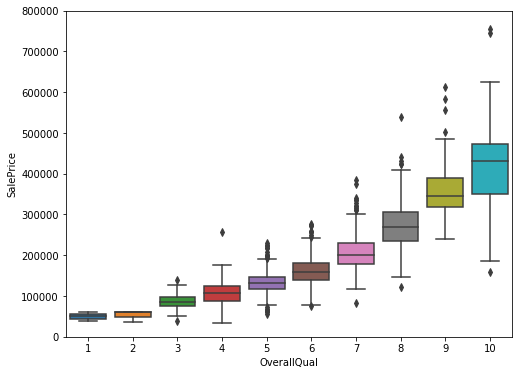 `SalePrice`与`OverallQual`与成正相关。 ```python var = 'YearBuilt' data = pd.concat([df_train['SalePrice'], df_train[var]], axis=1) f, ax = plt.subplots(figsize=(16, 8)) fig = sns.boxplot(x=var, y="SalePrice", data=data) fig.axis(ymin=0, ymax=800000); plt.xticks(rotation=90); ``` 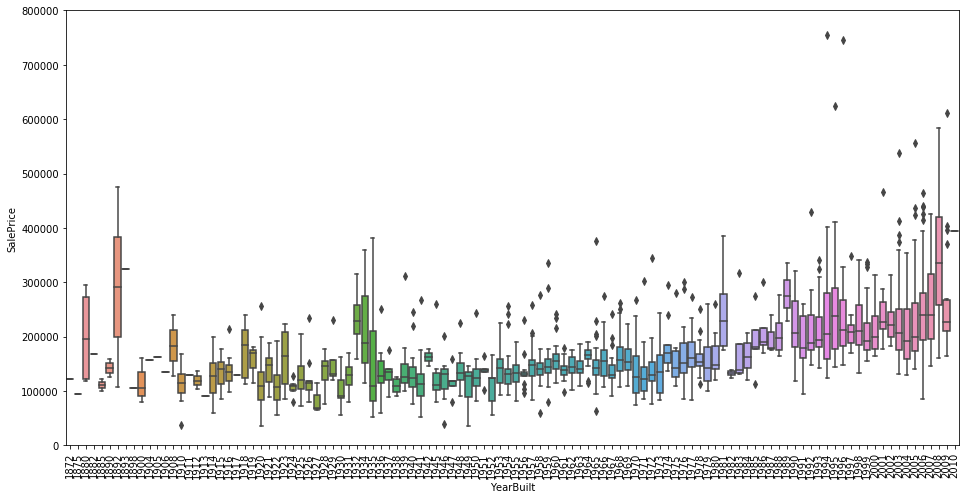 Although it's not a strong tendency, I'd say that 'SalePrice' is more prone to spend more money in new stuff than in old relics. **总结** - “GrLivArea”和“TotalBsmtSF”似乎与“SalePrice”线性相关。 两者正相关。 在“TotalBsmtSF”的情况下,我们可以看到线性关系的斜率特别高。 - “OverallQual”和“YearBuilt”似乎也与“SalePrice”有关。 在“OverallQual”的情况下,这种关系似乎更强一些,箱形图显示销售价格随整体质量的变化。 我们只分析了四个变量,但还有很多其他的变量应该分析。 这里的诀窍似乎是选择正确的特征(特征选择),而不是它们之间复杂关系的定义(特征工程)。 接下来分析相关性,从相关性热力图中可以明显的看到房价和变量的相关关系。 ```python #correlation matrix 相关性 corrmat = df_train.corr() # print(corrmat) f, ax = plt.subplots(figsize=(12, 9)) sns.heatmap(corrmat, vmax=.8, square=True); ``` 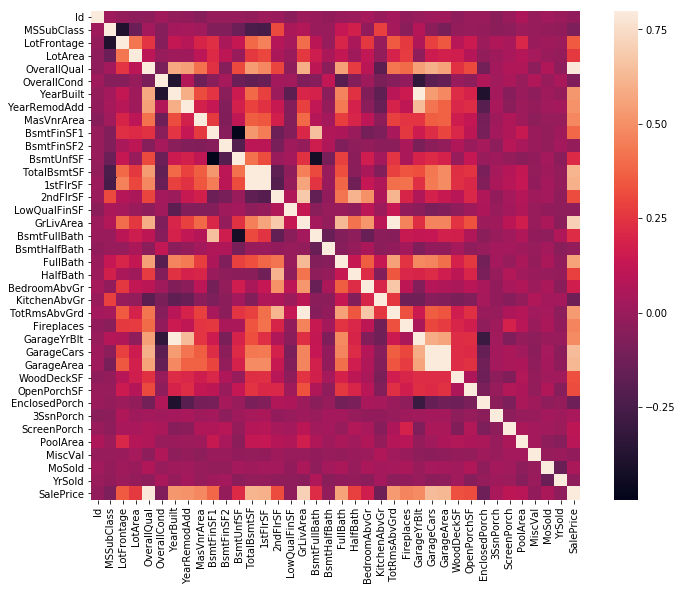 At first sight, there are two red colored squares that get my attention. The first one refers to the 'TotalBsmtSF' and '1stFlrSF' variables, and the second one refers to the 'GarageX' variables. Both cases show how significant the correlation is between these variables. Actually, this correlation is so strong that it can indicate a situation of multicollinearity. If we think about these variables, we can conclude that they give almost the same information so multicollinearity really occurs. Heatmaps are great to detect this kind of situations and in problems dominated by feature selection, like ours, they are an essential tool. Another thing that got my attention was the 'SalePrice' correlations. We can see our well-known 'GrLivArea', 'TotalBsmtSF', and 'OverallQual' saying a big 'Hi!', but we can also see many other variables that should be taken into account. That's what we will do next. ```python #saleprice correlation matrix k = 10 #number of variables for heatmap # 按照SalePrice排序,取前十个最大的列的索引 cols = corrmat.nlargest(k, 'SalePrice')['SalePrice'].index # print(cols) # print(df_train[cols]) # print('--------') # print(df_train[cols].values) # # cm = np.corrcoef(df_train[cols].values) # print(cm) # print('--------') # print(df_train[cols].values.T)、 # 转置是因为 当np相关性只传入一个参数是,可以把每行当成一个向量,分别计算不同行向量之间相关性,直接读进来的列向量,所以这里需要转置 cm = np.corrcoef(df_train[cols].values.T) # print(cm) sns.set(font_scale=1.25) hm = sns.heatmap(cm, cbar=True, annot=True, square=True, fmt='.2f', annot_kws={'size': 10}, yticklabels=cols.values, xticklabels=cols.values) plt.show() ``` 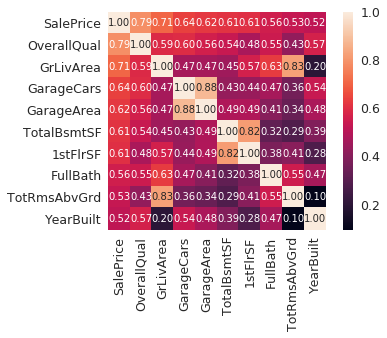 ```python sns.set() cols = ['SalePrice', 'OverallQual', 'GrLivArea', 'GarageCars', 'TotalBsmtSF', 'FullBath', 'YearBuilt'] sns.pairplot(df_train[cols], size = 2.5) plt.show() ``` 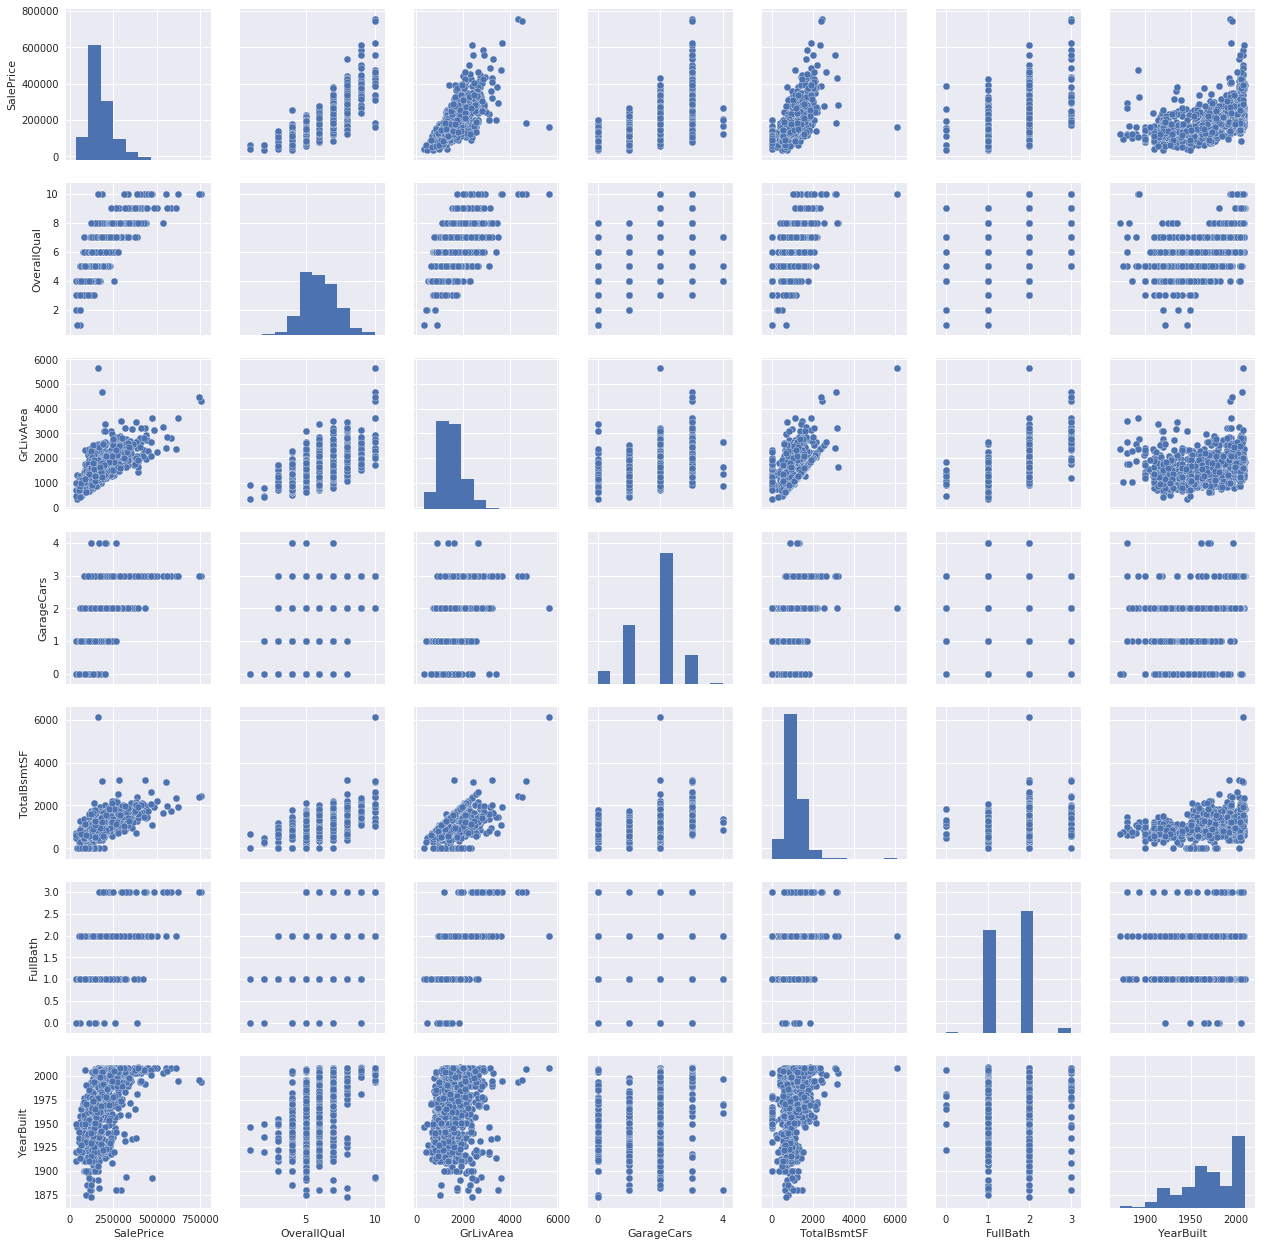 ### 数据清理 ```python # missing data total = df_train.isnull().sum().sort_values(ascending=False) percent = (df_train.isnull().sum()/df_train.isnull().count()).sort_values(ascending=False) missing_data = pd.concat([total, percent], axis=1, keys=['Total', 'Percent']) missing_data.head(20) ``` <div><style scoped> .dataframe tbody tr th:only-of-type { vertical-align: middle; } .dataframe tbody tr th { vertical-align: top; } .dataframe thead th { text-align: right; }</style><table border="1" class="dataframe"> <thead> <tr style="text-align: right;"> <th></th> <th>Total</th> <th>Percent</th> </tr> </thead> <tbody> <tr> <th>PoolQC</th> <td>1453</td> <td>0.995205</td> </tr> <tr> <th>MiscFeature</th> <td>1406</td> <td>0.963014</td> </tr> <tr> <th>Alley</th> <td>1369</td> <td>0.937671</td> </tr> <tr> <th>Fence</th> <td>1179</td> <td>0.807534</td> </tr> <tr> <th>FireplaceQu</th> <td>690</td> <td>0.472603</td> </tr> <tr> <th>LotFrontage</th> <td>259</td> <td>0.177397</td> </tr> <tr> <th>GarageCond</th> <td>81</td> <td>0.055479</td> </tr> <tr> <th>GarageType</th> <td>81</td> <td>0.055479</td> </tr> <tr> <th>GarageYrBlt</th> <td>81</td> <td>0.055479</td> </tr> <tr> <th>GarageFinish</th> <td>81</td> <td>0.055479</td> </tr> <tr> <th>GarageQual</th> <td>81</td> <td>0.055479</td> </tr> <tr> <th>BsmtExposure</th> <td>38</td> <td>0.026027</td> </tr> <tr> <th>BsmtFinType2</th> <td>38</td> <td>0.026027</td> </tr> <tr> <th>BsmtFinType1</th> <td>37</td> <td>0.025342</td> </tr> <tr> <th>BsmtCond</th> <td>37</td> <td>0.025342</td> </tr> <tr> <th>BsmtQual</th> <td>37</td> <td>0.025342</td> </tr> <tr> <th>MasVnrArea</th> <td>8</td> <td>0.005479</td> </tr> <tr> <th>MasVnrType</th> <td>8</td> <td>0.005479</td> </tr> <tr> <th>Electrical</th> <td>1</td> <td>0.000685</td> </tr> <tr> <th>Utilities</th> <td>0</td> <td>0.000000</td> </tr> </tbody></table></div> ```python #dealing with missing data df_train = df_train.drop((missing_data[missing_data['Total'] > 1]).index,1) df_train = df_train.drop(df_train.loc[df_train['Electrical'].isnull()].index) df_train.isnull().sum().max() #just checking that there's no missing data missing... ``` 0 ```python #standardizing data saleprice_scaled = StandardScaler().fit_transform(df_train['SalePrice'][:,np.newaxis]); # print(saleprice_scaled) low_range = saleprice_scaled[saleprice_scaled[:,0].argsort()][:10] high_range= saleprice_scaled[saleprice_scaled[:,0].argsort()][-10:] print('outer range (low) of the distribution:') print(low_range) print('\nouter range (high) of the distribution:') print(high_range) ``` outer range (low) of the distribution: [[-1.83820775] [-1.83303414] [-1.80044422] [-1.78282123] [-1.77400974] [-1.62295562] [-1.6166617 ] [-1.58519209] [-1.58519209] [-1.57269236]] outer range (high) of the distribution: [[ 3.82758058] [ 4.0395221 ] [ 4.49473628] [ 4.70872962] [ 4.728631 ] [ 5.06034585] [ 5.42191907] [ 5.58987866] [ 7.10041987] [ 7.22629831]] ```python # bivariate analysis saleprice/grlivarea var = 'GrLivArea' data = pd.concat([df_train['SalePrice'], df_train[var]], axis=1) data.plot.scatter(x=var, y='SalePrice', ylim=(0,800000)); ``` 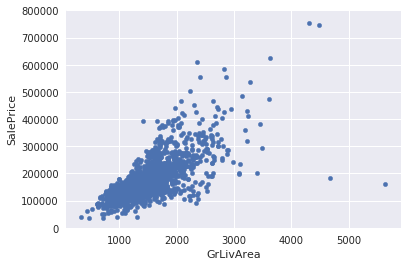 ```python #deleting points df_train.sort_values(by = 'GrLivArea', ascending = False)[:2] ``` <div><style scoped> .dataframe tbody tr th:only-of-type { vertical-align: middle; } .dataframe tbody tr th { vertical-align: top; } .dataframe thead th { text-align: right; }</style><table border="1" class="dataframe"> <thead> <tr style="text-align: right;"> <th></th> <th>Id</th> <th>MSSubClass</th> <th>MSZoning</th> <th>LotArea</th> <th>Street</th> <th>LotShape</th> <th>LandContour</th> <th>Utilities</th> <th>LotConfig</th> <th>LandSlope</th> <th>...</th> <th>EnclosedPorch</th> <th>3SsnPorch</th> <th>ScreenPorch</th> <th>PoolArea</th> <th>MiscVal</th> <th>MoSold</th> <th>YrSold</th> <th>SaleType</th> <th>SaleCondition</th> <th>SalePrice</th> </tr> </thead> <tbody> <tr> <th>1298</th> <td>1299</td> <td>60</td> <td>RL</td> <td>63887</td> <td>Pave</td> <td>IR3</td> <td>Bnk</td> <td>AllPub</td> <td>Corner</td> <td>Gtl</td> <td>...</td> <td>0</td> <td>0</td> <td>0</td> <td>480</td> <td>0</td> <td>1</td> <td>2008</td> <td>New</td> <td>Partial</td> <td>160000</td> </tr> <tr> <th>523</th> <td>524</td> <td>60</td> <td>RL</td> <td>40094</td> <td>Pave</td> <td>IR1</td> <td>Bnk</td> <td>AllPub</td> <td>Inside</td> <td>Gtl</td> <td>...</td> <td>0</td> <td>0</td> <td>0</td> <td>0</td> <td>0</td> <td>10</td> <td>2007</td> <td>New</td> <td>Partial</td> <td>184750</td> </tr> </tbody></table><p>2 rows × 63 columns</p></div> ```python df_train = df_train.drop(df_train[df_train['Id'] == 1299].index) df_train = df_train.drop(df_train[df_train['Id'] == 524].index) ``` ### 验证正态性 ```python #bivariate analysis saleprice/grlivarea var = 'TotalBsmtSF' data = pd.concat([df_train['SalePrice'], df_train[var]], axis=1) data.plot.scatter(x=var, y='SalePrice', ylim=(0,800000)); ``` 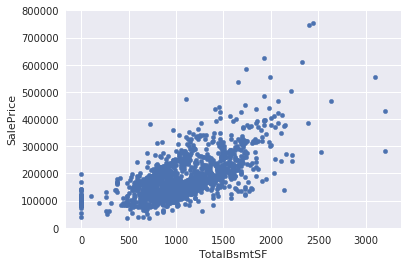 ```python #histogram and normal probability plot sns.distplot(df_train['SalePrice'], fit=norm); fig = plt.figure() # 正态分布检验 res = stats.probplot(df_train['SalePrice'], plot=plt) ``` 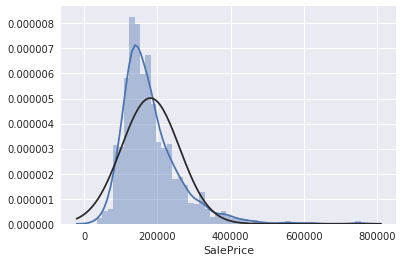 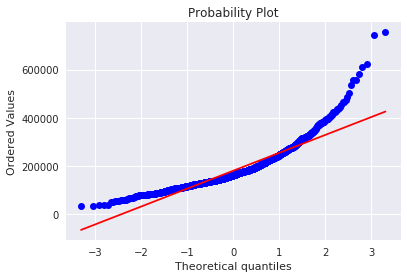 ```python #applying log transformation df_train['SalePrice'] = np.log(df_train['SalePrice']) ``` ```python #transformed histogram and normal probability plot sns.distplot(df_train['SalePrice'], fit=norm); fig = plt.figure() res = stats.probplot(df_train['SalePrice'], plot=plt) ``` 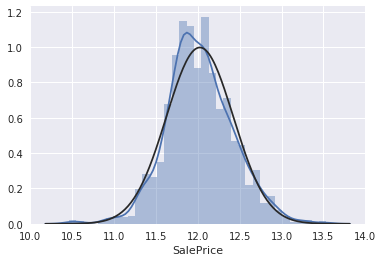 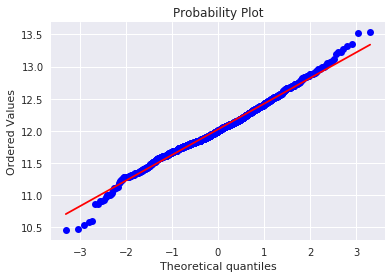 ```python #histogram and normal probability plot sns.distplot(df_train['GrLivArea'], fit=norm); fig = plt.figure() res = stats.probplot(df_train['GrLivArea'], plot=plt) ``` 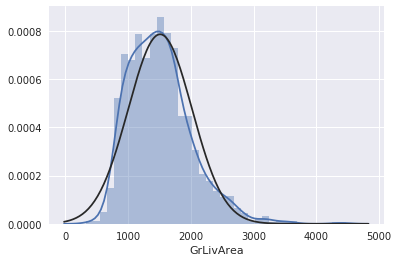 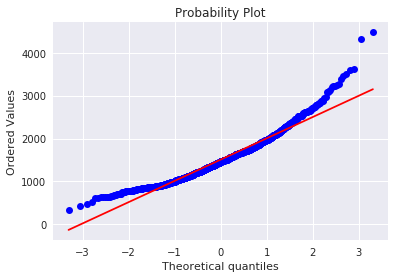 ```python #data transformation df_train['GrLivArea'] = np.log(df_train['GrLivArea']) ``` ```python #transformed histogram and normal probability plot sns.distplot(df_train['GrLivArea'], fit=norm); fig = plt.figure() res = stats.probplot(df_train['GrLivArea'], plot=plt) ``` 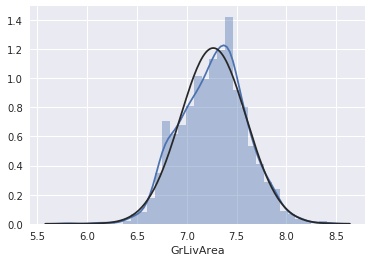 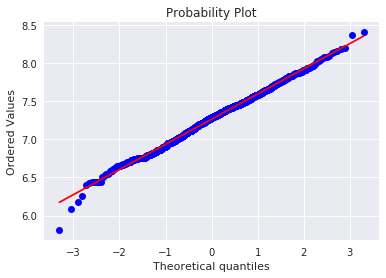 ```python #histogram and normal probability plot sns.distplot(df_train['TotalBsmtSF'], fit=norm); fig = plt.figure() res = stats.probplot(df_train['TotalBsmtSF'], plot=plt) ``` 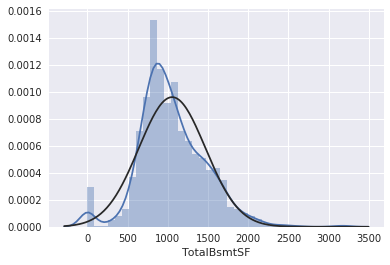 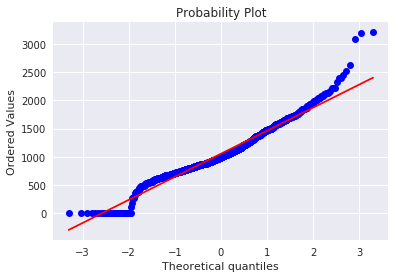 ```python # 评论里有人说可以用log1p = log(x+1) 来解决x为0的情况 #create column for new variable (one is enough because it's a binary categorical feature) #if area>0 it gets 1, for area==0 it gets 0 df_train['HasBsmt'] = pd.Series(len(df_train['TotalBsmtSF']), index=df_train.index) df_train['HasBsmt'] = 0 df_train.loc[df_train['TotalBsmtSF']>0,'HasBsmt'] = 1 ``` ```python #transform data df_train.loc[df_train['HasBsmt']==1,'TotalBsmtSF'] = np.log(df_train['TotalBsmtSF']) ``` ```python #histogram and normal probability plot sns.distplot(df_train[df_train['TotalBsmtSF']>0]['TotalBsmtSF'], fit=norm); fig = plt.figure() res = stats.probplot(df_train[df_train['TotalBsmtSF']>0]['TotalBsmtSF'], plot=plt) ``` 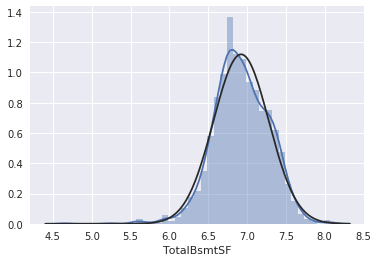 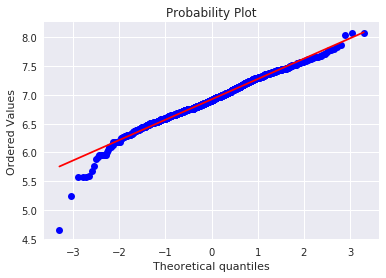 ```python #scatter plot plt.scatter(df_train['GrLivArea'], df_train['SalePrice']); ``` 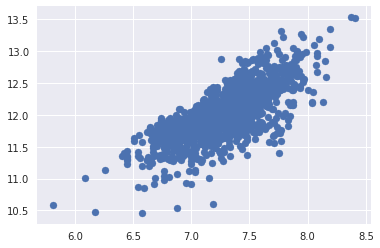 ```python #scatter plot plt.scatter(df_train[df_train['TotalBsmtSF']>0]['TotalBsmtSF'], df_train[df_train['TotalBsmtSF']>0]['SalePrice']); ``` 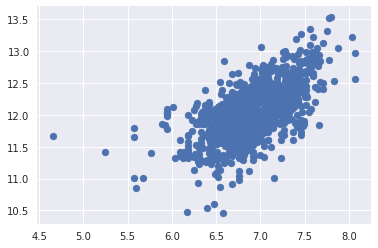 ```python # 最后 one-hot编码 (针对类别) df_train = pd.get_dummies(df_train) ``` ```python df_train.head(20) ``` <div><style scoped> .dataframe tbody tr th:only-of-type { vertical-align: middle; } .dataframe tbody tr th { vertical-align: top; } .dataframe thead th { text-align: right; }</style><table border="1" class="dataframe"> <thead> <tr style="text-align: right;"> <th></th> <th>Id</th> <th>MSSubClass</th> <th>LotArea</th> <th>OverallQual</th> <th>OverallCond</th> <th>YearBuilt</th> <th>YearRemodAdd</th> <th>BsmtFinSF1</th> <th>BsmtFinSF2</th> <th>BsmtUnfSF</th> <th>...</th> <th>SaleType_ConLw</th> <th>SaleType_New</th> <th>SaleType_Oth</th> <th>SaleType_WD</th> <th>SaleCondition_Abnorml</th> <th>SaleCondition_AdjLand</th> <th>SaleCondition_Alloca</th> <th>SaleCondition_Family</th> <th>SaleCondition_Normal</th> <th>SaleCondition_Partial</th> </tr> </thead> <tbody> <tr> <th>0</th> <td>1</td> <td>60</td> <td>8450</td> <td>7</td> <td>5</td> <td>2003</td> <td>2003</td> <td>706</td> <td>0</td> <td>150</td> <td>...</td> <td>0</td> <td>0</td> <td>0</td> <td>1</td> <td>0</td> <td>0</td> <td>0</td> <td>0</td> <td>1</td> <td>0</td> </tr> <tr> <th>1</th> <td>2</td> <td>20</td> <td>9600</td> <td>6</td> <td>8</td> <td>1976</td> <td>1976</td> <td>978</td> <td>0</td> <td>284</td> <td>...</td> <td>0</td> <td>0</td> <td>0</td> <td>1</td> <td>0</td> <td>0</td> <td>0</td> <td>0</td> <td>1</td> <td>0</td> </tr> <tr> <th>2</th> <td>3</td> <td>60</td> <td>11250</td> <td>7</td> <td>5</td> <td>2001</td> <td>2002</td> <td>486</td> <td>0</td> <td>434</td> <td>...</td> <td>0</td> <td>0</td> <td>0</td> <td>1</td> <td>0</td> <td>0</td> <td>0</td> <td>0</td> <td>1</td> <td>0</td> </tr> <tr> <th>3</th> <td>4</td> <td>70</td> <td>9550</td> <td>7</td> <td>5</td> <td>1915</td> <td>1970</td> <td>216</td> <td>0</td> <td>540</td> <td>...</td> <td>0</td> <td>0</td> <td>0</td> <td>1</td> <td>1</td> <td>0</td> <td>0</td> <td>0</td> <td>0</td> <td>0</td> </tr> <tr> <th>4</th> <td>5</td> <td>60</td> <td>14260</td> <td>8</td> <td>5</td> <td>2000</td> <td>2000</td> <td>655</td> <td>0</td> <td>490</td> <td>...</td> <td>0</td> <td>0</td> <td>0</td> <td>1</td> <td>0</td> <td>0</td> <td>0</td> <td>0</td> <td>1</td> <td>0</td> </tr> <tr> <th>5</th> <td>6</td> <td>50</td> <td>14115</td> <td>5</td> <td>5</td> <td>1993</td> <td>1995</td> <td>732</td> <td>0</td> <td>64</td> <td>...</td> <td>0</td> <td>0</td> <td>0</td> <td>1</td> <td>0</td> <td>0</td> <td>0</td> <td>0</td> <td>1</td> <td>0</td> </tr> <tr> <th>6</th> <td>7</td> <td>20</td> <td>10084</td> <td>8</td> <td>5</td> <td>2004</td> <td>2005</td> <td>1369</td> <td>0</td> <td>317</td> <td>...</td> <td>0</td> <td>0</td> <td>0</td> <td>1</td> <td>0</td> <td>0</td> <td>0</td> <td>0</td> <td>1</td> <td>0</td> </tr> <tr> <th>7</th> <td>8</td> <td>60</td> <td>10382</td> <td>7</td> <td>6</td> <td>1973</td> <td>1973</td> <td>859</td> <td>32</td> <td>216</td> <td>...</td> <td>0</td> <td>0</td> <td>0</td> <td>1</td> <td>0</td> <td>0</td> <td>0</td> <td>0</td> <td>1</td> <td>0</td> </tr> <tr> <th>8</th> <td>9</td> <td>50</td> <td>6120</td> <td>7</td> <td>5</td> <td>1931</td> <td>1950</td> <td>0</td> <td>0</td> <td>952</td> <td>...</td> <td>0</td> <td>0</td> <td>0</td> <td>1</td> <td>1</td> <td>0</td> <td>0</td> <td>0</td> <td>0</td> <td>0</td> </tr> <tr> <th>9</th> <td>10</td> <td>190</td> <td>7420</td> <td>5</td> <td>6</td> <td>1939</td> <td>1950</td> <td>851</td> <td>0</td> <td>140</td> <td>...</td> <td>0</td> <td>0</td> <td>0</td> <td>1</td> <td>0</td> <td>0</td> <td>0</td> <td>0</td> <td>1</td> <td>0</td> </tr> <tr> <th>10</th> <td>11</td> <td>20</td> <td>11200</td> <td>5</td> <td>5</td> <td>1965</td> <td>1965</td> <td>906</td> <td>0</td> <td>134</td> <td>...</td> <td>0</td> <td>0</td> <td>0</td> <td>1</td> <td>0</td> <td>0</td> <td>0</td> <td>0</td> <td>1</td> <td>0</td> </tr> <tr> <th>11</th> <td>12</td> <td>60</td> <td>11924</td> <td>9</td> <td>5</td> <td>2005</td> <td>2006</td> <td>998</td> <td>0</td> <td>177</td> <td>...</td> <td>0</td> <td>1</td> <td>0</td> <td>0</td> <td>0</td> <td>0</td> <td>0</td> <td>0</td> <td>0</td> <td>1</td> </tr> <tr> <th>12</th> <td>13</td> <td>20</td> <td>12968</td> <td>5</td> <td>6</td> <td>1962</td> <td>1962</td> <td>737</td> <td>0</td> <td>175</td> <td>...</td> <td>0</td> <td>0</td> <td>0</td> <td>1</td> <td>0</td> <td>0</td> <td>0</td> <td>0</td> <td>1</td> <td>0</td> </tr> <tr> <th>13</th> <td>14</td> <td>20</td> <td>10652</td> <td>7</td> <td>5</td> <td>2006</td> <td>2007</td> <td>0</td> <td>0</td> <td>1494</td> <td>...</td> <td>0</td> <td>1</td> <td>0</td> <td>0</td> <td>0</td> <td>0</td> <td>0</td> <td>0</td> <td>0</td> <td>1</td> </tr> <tr> <th>14</th> <td>15</td> <td>20</td> <td>10920</td> <td>6</td> <td>5</td> <td>1960</td> <td>1960</td> <td>733</td> <td>0</td> <td>520</td> <td>...</td> <td>0</td> <td>0</td> <td>0</td> <td>1</td> <td>0</td> <td>0</td> <td>0</td> <td>0</td> <td>1</td> <td>0</td> </tr> <tr> <th>15</th> <td>16</td> <td>45</td> <td>6120</td> <td>7</td> <td>8</td> <td>1929</td> <td>2001</td> <td>0</td> <td>0</td> <td>832</td> <td>...</td> <td>0</td> <td>0</td> <td>0</td> <td>1</td> <td>0</td> <td>0</td> <td>0</td> <td>0</td> <td>1</td> <td>0</td> </tr> <tr> <th>16</th> <td>17</td> <td>20</td> <td>11241</td> <td>6</td> <td>7</td> <td>1970</td> <td>1970</td> <td>578</td> <td>0</td> <td>426</td> <td>...</td> <td>0</td> <td>0</td> <td>0</td> <td>1</td> <td>0</td> <td>0</td> <td>0</td> <td>0</td> <td>1</td> <td>0</td> </tr> <tr> <th>17</th> <td>18</td> <td>90</td> <td>10791</td> <td>4</td> <td>5</td> <td>1967</td> <td>1967</td> <td>0</td> <td>0</td> <td>0</td> <td>...</td> <td>0</td> <td>0</td> <td>0</td> <td>1</td> <td>0</td> <td>0</td> <td>0</td> <td>0</td> <td>1</td> <td>0</td> </tr> <tr> <th>18</th> <td>19</td> <td>20</td> <td>13695</td> <td>5</td> <td>5</td> <td>2004</td> <td>2004</td> <td>646</td> <td>0</td> <td>468</td> <td>...</td> <td>0</td> <td>0</td> <td>0</td> <td>1</td> <td>0</td> <td>0</td> <td>0</td> <td>0</td> <td>1</td> <td>0</td> </tr> <tr> <th>19</th> <td>20</td> <td>20</td> <td>7560</td> <td>5</td> <td>6</td> <td>1958</td> <td>1965</td> <td>504</td> <td>0</td> <td>525</td> <td>...</td> <td>0</td> <td>0</td> <td>0</td> <td>0</td> <td>1</td> <td>0</td> <td>0</td> <td>0</td> <td>0</td> <td>0</td> </tr> </tbody></table><p>20 rows × 222 columns</p></div>