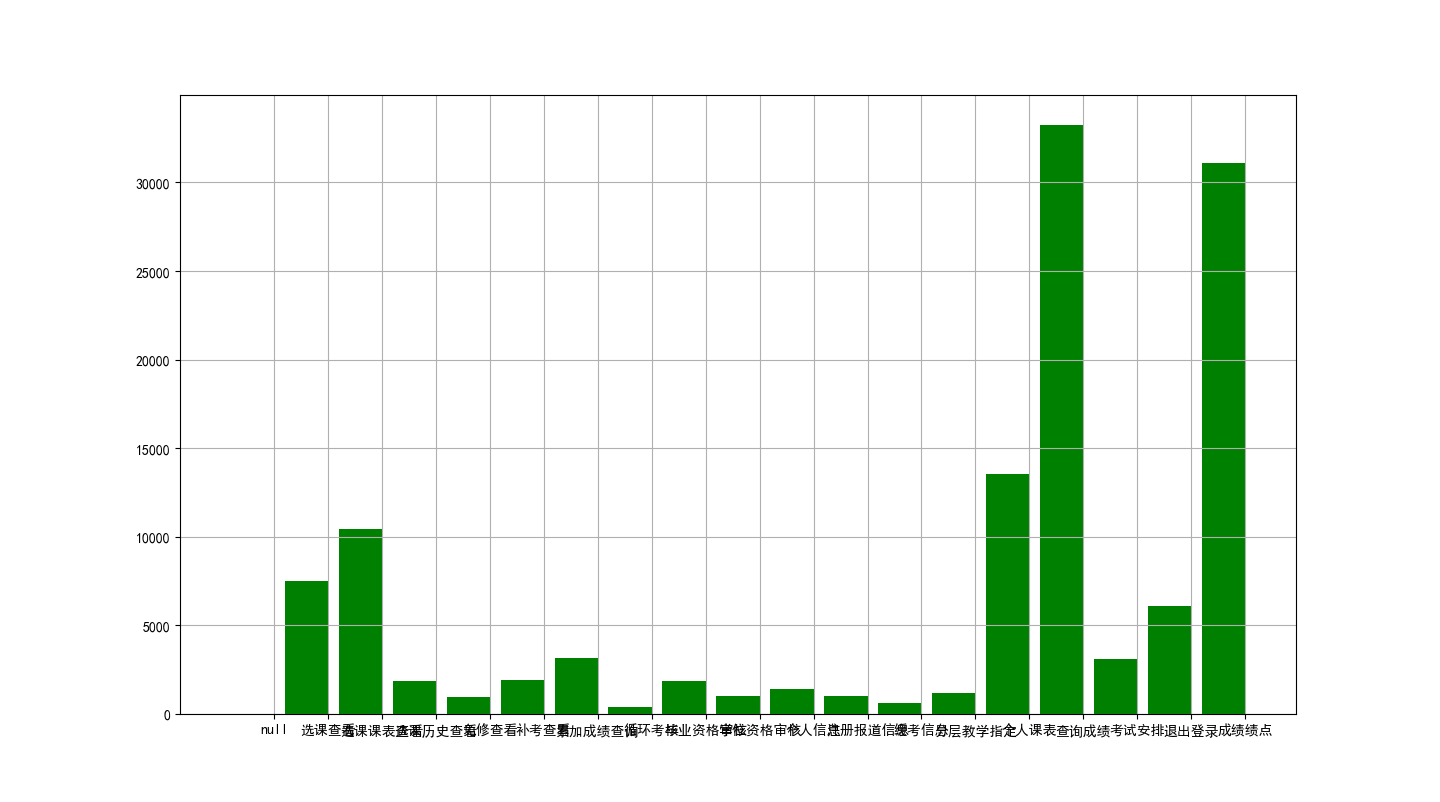
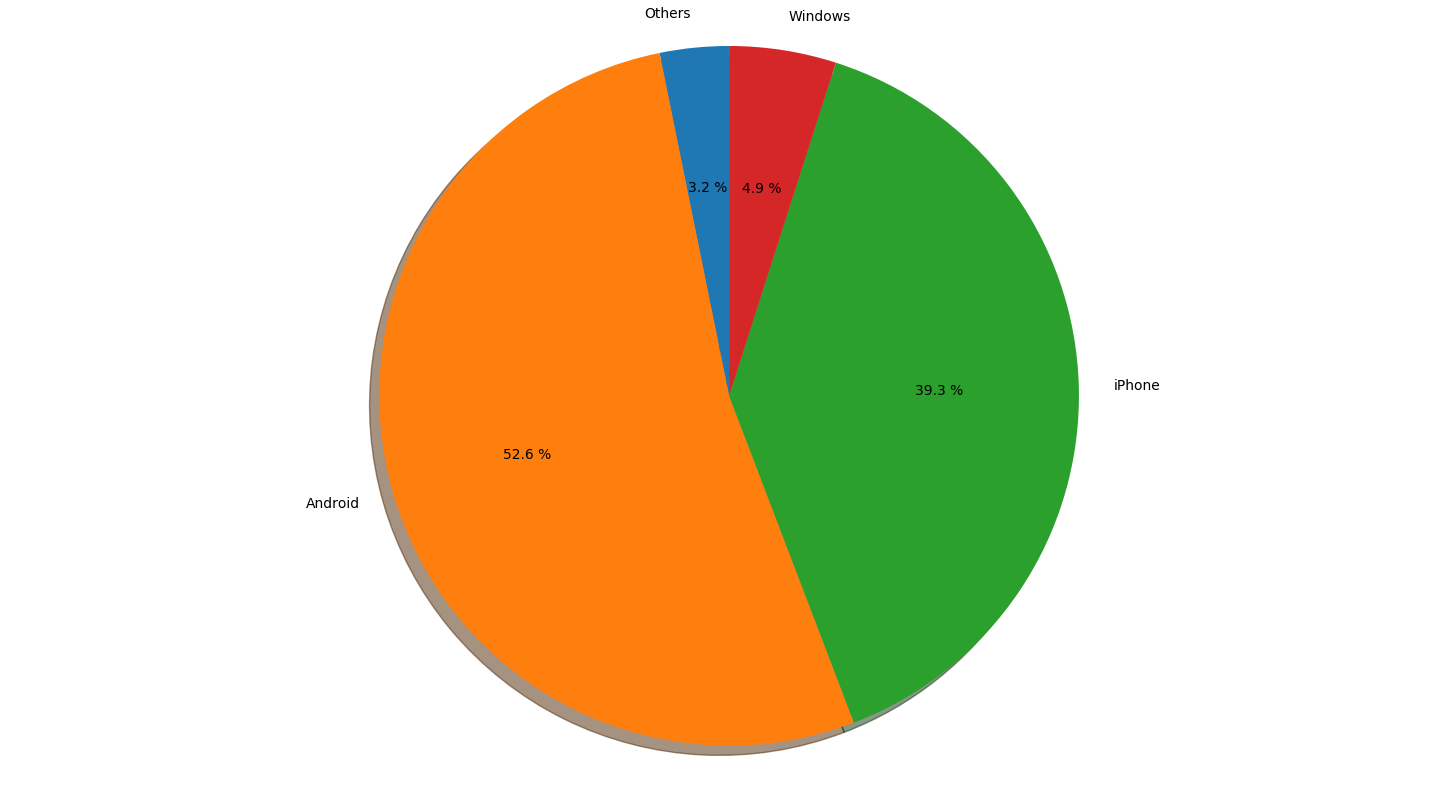
Python 统计 SAE 日志脚本 April 9, 2018 > 之前统计教务系统客户端分布写的脚本,整理备忘。移动教务系统很纯粹,几乎没有任何后台功能,也没xx统计,只能靠分析近期日志进行粗略统计了。   <!--more--> ```python # coding = utf-8 import os import re x = [ 'null','选课查看','选课课表查看','选课历史查看','免修查看','补考查看','累加成绩查询', '循环考核','毕业资格审核','学位资格审核', '个人信息','注册报道信息', '缓考信息','分层教学指定','个人课表','查询成绩','考试安排','退出登录','成绩绩点' ] data = [0,0,0,0,0,0,0,0,0,0,0,0,0,0,0,0,0,0,0] print(len(x),len(data)) for log in os.listdir('./log'): with open('./log/'+ log,'r') as f: for line in f: page = re.findall('view.php\?id=(.*?) HTTP',line,re.S) if(len(page)>0): num = re.findall('\\d+',page[0]) if(len(num)>0): i = int(num[0]) if(i<20): data[i]+=1 print(data) import numpy as np import matplotlib.mlab as mlab import matplotlib.pyplot as plt from matplotlib.font_manager import FontManager from pylab import mpl import subprocess def get_matplot_zh_font(): fm = FontManager() mat_fonts = set(f.name for f in fm.ttflist) output = subprocess.check_output('fc-list :lang=zh -f "%{family}\n"', shell=True) zh_fonts = set(f.split(',', 1)[0] for f in output.split('\n')) available = list(mat_fonts & zh_fonts) print ('*' * 10, '可用的字体', '*' * 10) for f in available: print (f) return available def set_matplot_zh_font(): available = get_matplot_zh_font() if len(available) > 0: mpl.rcParams['font.sans-serif'] = [available[0]] # 指定默认字体 mpl.rcParams['axes.unicode_minus'] = False # 解决保存图像是负号'-'显示为方块的问题 mpl.rcParams['font.sans-serif'] = ['SimHei'] def draw_bar(labels,quants): width = 0.4 ind = np.linspace(0.5,9.5,19) # make a square figure fig = plt.figure(1) ax = fig.add_subplot(111) # Bar Plot ax.bar(ind-width/2,quants,width,color='green') # Set the ticks on x-axis ax.set_xticks(ind) ax.set_xticklabels(labels) # labels ax.set_xlabel('Country') ax.set_ylabel('GDP (Billion US dollar)') # title ax.set_title('Top 10 GDP Countries', bbox={'facecolor':'0.8', 'pad':5}) plt.grid(True) plt.show() draw_bar(x,data) ``` ```python # coding = utf-8 import os import re ips = [] Android = 0 iPhone = 0 Windows = 0 Others = 0 for log in os.listdir('./log'): with open('./log/'+ log,'r') as f: for line in f: ip = re.findall('jxxx.feelncut.com (.*?) ',line,re.S) if(len(ip)>0): if(ip[0] not in ips): ips.append(ip[0]) if(line.find('Android')!=-1): Android += 1 elif(line.find('iPhone')!=-1): iPhone += 1 elif(line.find('Windows')!=-1): Windows += 1 else: Others += 1 print(Android,iPhone,Windows,Android+iPhone+Windows) print(len(ips)) import numpy as np import matplotlib.pyplot as plt labels = 'Others' ,'Android', 'iPhone', 'Windows' fracs = [Others,Android,iPhone,Windows] explode = [0, 0, 0, 0] # 0.1 凸出这部分, plt.axes(aspect=1) # set this , Figure is round, otherwise it is an ellipse #autopct ,show percet plt.pie(x=fracs, labels=labels, explode=explode,autopct='%3.1f %%', shadow=True, labeldistance=1.1, startangle = 90,pctdistance = 0.6 ) ''' labeldistance,文本的位置离远点有多远,1.1指1.1倍半径的位置 autopct,圆里面的文本格式,%3.1f%%表示小数有三位,整数有一位的浮点数 shadow,饼是否有阴影 startangle,起始角度,0,表示从0开始逆时针转,为第一块。一般选择从90度开始比较好看 pctdistance,百分比的text离圆心的距离 patches, l_texts, p_texts,为了得到饼图的返回值,p_texts饼图内部文本的,l_texts饼图外label的文本 ''' plt.show() ```